Evaluating Zero-Shot NER: What It Takes to Not Fool Yourself
GLiNER, GLiNER2, and prompted LLMs on 46 NER datasets — and the three ways a zero-shot NER leaderboard quietly misleads you (unfair aggregation, no uncertainty, inflated absolutes), plus how to fix each.
Zero-shot NER has a tooling gap. GLiNER-family models and prompted LLMs will happily extract any entity type you name at inference time, but there’s no EuroEval-equivalent to rank them fairly across many datasets. So people do what I did first: run every model on every dataset, average the F1s, sort descending, and post the table.
That table is almost always misleading — in three specific, fixable ways. I built nerbench to stop making those three mistakes. This post is about the mistakes more than the tool, because they generalize to any zero-shot evaluation.
The harness benchmarks GLiNER, GLiNER2, and any LLM (via LiteLLM — Anthropic/OpenAI/Gemini/local) against a common set of 46 NER datasets under one canonical char-offset schema, scored with all four SemEval’13 matching schemes through nervaluate. Everything below is reproducible from the repo.
First, what counts as “correct”?
NER scoring isn’t binary. A prediction can nail the span but mislabel the type, or get the type right while the boundaries are off by a token. The SemEval’13 schemes — the ones nervaluate implements and nerbench stores all four of — are just the 2×2 of those two questions: must the boundary be exact, and must the type match?
- Strict — exact boundary and correct type. Forgives nothing.
- Exact — exact boundary, type ignored. “Did you find the span?”
- Type (
ent_type) — correct type with any boundary overlap. “Did you know it’s an organization, roughly here?” - Partial — boundary overlap, type ignored, with half credit for inexact spans. “Warm, ignoring the label.”
A worked example — gold is University of Paris, typed organization — makes the differences concrete:
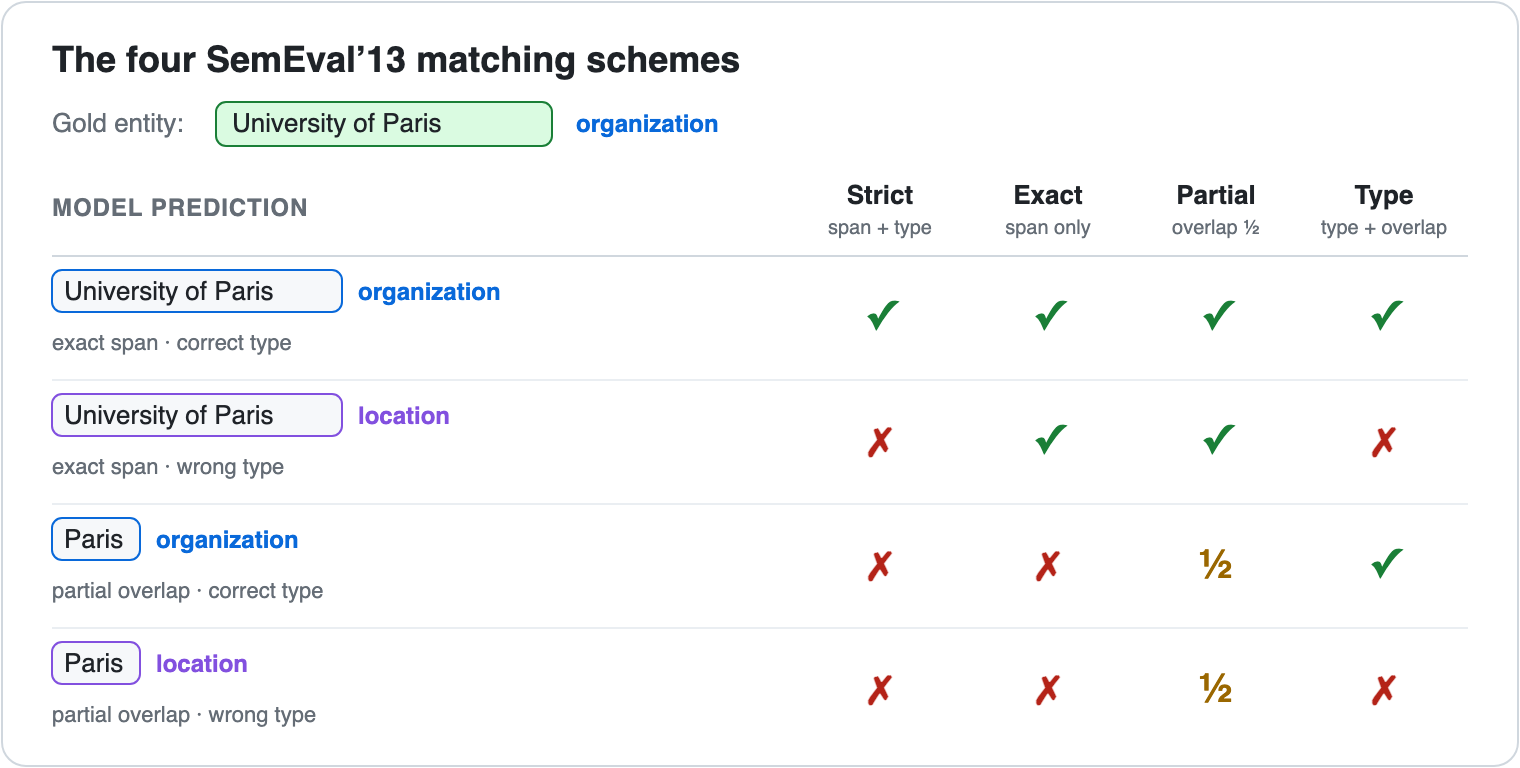
Keeping all four — instead of silently reporting one, as papers often do — is what lets the dashboard toggle between them. And the strict-vs-partial gap turns out to be a diagnostic in its own right: a model at 0.15 strict but 0.60 partial is locating the right region and fumbling the exact boundary — a completely different failure from one that simply misses entities. More on that below.
Mistake 1: averaging over datasets that aren’t comparable
The headline mean-F1 across all datasets number is the seductive one, and it’s the worst. Two problems compound:
English-only vs multilingual models don’t compete on the same board. An English-only checkpoint evaluated on 21 English datasets and a multilingual one evaluated on 46 (including Hindi and Chinese, where everyone scores ~0.1–0.3) get averaged on totally different denominators. Whoever avoided the hard languages looks better — for not trying.
Language gets hidden inside “general.” A German WikiANN split and English CoNLL both carry domain=general, so a naive grouping dumps them into one wide table and one average. But recognizing entities in German is not the same task as English; mixing them produces a number that means nothing.
The fix is to rank like-with-like. nerbench organizes results into role tracks — General (English), Multilingual, and Specialists (split into PII and biomedical) — and aggregates with mean rank (rank each model per dataset, average the ranks) rather than mean F1, so one easy dataset can’t dominate. Crucially, models only run where it’s fair: a YAML plan scopes each model to the datasets it should be judged on. That alone cut a naive 1,242-run all-vs-all matrix down to ~690 meaningful runs.
 Each track crowns a different winner — which is exactly what collapsing everything into one number would have hidden.
For the multilingual track specifically, I borrowed EuroEval’s idea of language families. Instead of 16 noisy per-language columns, collapse them into English / Germanic / Scandinavian / Romance / Slavic / CJK, and rank on non-English datasets only so an English-only model can’t score well by abstaining. The family view immediately shows the shape of a model’s multilinguality that a single average erases:
| model | Germanic | Scandinavian | Romance | Slavic | CJK |
|---|---|---|---|---|---|
knowledgator/gliner-x-large | 0.73 | 0.84 | 0.70 | 0.72 | 0.33 |
Strong across European families, falls off a cliff on CJK (0.33) — the same whitespace-tokenization failure mode that every model in the set shares, and that pre-tokenized paper protocols conveniently hide.
Mistake 2: reporting point estimates with no uncertainty
Everybody runs --limit 100 for a quick benchmark and then reads the resulting table as if 0.62 and 0.59 are meaningfully different. They usually aren’t.
F1 in NER is computed over entities, not documents. 100 documents of CoNLL is only ~217 gold entities. Treat F1 like a proportion and the 95% CI half-width is roughly 1.96·√(p(1−p)/n) with a design-effect penalty for entities clustering within a document — which lands around ±0.05–0.08 at this sample size.
That’s not a hand-wave. nerbench stores the raw SemEval counts per cell and computes a percentile bootstrap 95% CI on F1 by resampling documents. A concrete measurement — urchade/gliner_small-v2.1 on CoNLL at limit 100:
1
strict F1 = 0.806   95% CI [0.725, 0.868]   (±0.071)
Across the whole 741-cell board, 36% of cells have a CI wider than 0.15. Any single-dataset gap smaller than ~0.07 is noise. The dashboard makes this visceral: hover any score for its interval, and cells with wide CIs get a dotted underline that says read with caution.
The saving grace — and the reason a leaderboard is still worth building — is that mean rank across ~20 datasets is far more stable than any one cell. The ordering survives even where individual numbers wobble. So the right posture is: trust the ranking, distrust the third decimal.
One practical consequence I hit: I couldn’t retrofit CIs onto older runs because I’d only stored aggregate P/R/F1, not predictions. So nerbench now writes a .pred.jsonl of raw gold/predicted spans alongside every run. That single decision unlocks the next section.
Mistake 3: comparing absolute scores to published papers
This one bit me hardest. My CoNLL numbers run ~15–20 F1 points above the published GLiNER-paper figures (our gliner_medium ≈ 0.85 vs the paper’s ~0.61). That’s not a better model — it’s a measurement artifact.
The cause: I derive gold spans from the same whitespace-joined text I feed the model. There’s no detokenization-mismatch penalty, which is a real source of error in setups that score against original tokenization. The scores are internally consistent and the relative rankings are trustworthy, but absolute cross-paper comparison is invalid. I now say this loudly in the README rather than quietly posting inflated numbers next to someone else’s honest ones.
The general lesson: a benchmark’s numbers are only comparable within its own protocol. The moment you put your number next to a paper’s, you’re claiming protocol equivalence you almost certainly don’t have.
What saved predictions buy you: offline error analysis
Because every prediction is on disk, you can re-derive why a model scores the way it does without re-running inference. Decompose each gold entity into: exact match, right-span-wrong-type, boundary-off, or missed — and count predictions with no gold overlap (over-prediction). That taxonomy separates very different failures that a single F1 blurs together:
- A large strict→partial gap with few outright misses = the model finds the region but botches exact boundaries (often honorific inclusion like
Mr Osborne, or under-extending morphological compounds). - High wrong-type = fuzzy label representations, not a detection problem.
- A high spurious rate = over-generation / calibration, not recall.
And since predictions carry confidence scores, you can sweep the decision threshold offline — re-filter the saved spans at 0.5/0.7/0.9 and watch precision and recall trade off — to find a better operating point without a single extra forward pass. A recall problem and a precision problem look identical on the leaderboard and demand opposite fixes; the predictions tell you which one you have.
The pieces, briefly
- Backends behind one interface:
gliner:(any GLiNER checkpoint),gliner2:(fastino GLiNER2’sextract_entitiesAPI),llm:(any provider through LiteLLM, with cost/context pulled from its model map). - Canonical schema: character offsets everywhere; every dataset converts once at load. Terse tags are prettified (
politicalparty→political party) because in zero-shot the label string is the prompt. - Config-scoped plans:
nerbench run configs/gliner.yamlexpands model globs × scoped suites into the run matrix. - Self-contained dashboard:
nerbench reportemits one dependency-free HTML file — role/adapter/language tracks, sortable columns, an F1 heatmap, hover-able CIs — so it hosts on GitHub Pages as easily as it opens locally.
A few findings that survive the caveats
Reading only relative rankings on the current board (26 models, 741 cells):
- PII specialists win their domain and stay strong generalists.
knowledgator/gliner-pii-largeandnvidia/gliner-PIItop the PII track (~0.69) and land near the top overall. The small PII specialists, by contrast, collapse outside their domain — specialization is only free at scale. - The best multilingual model is not the biggest generalist.
gliner-x-largeleads the non-English ranking comfortably, but its European-vs-CJK split shows there’s no such thing as “multilingual” in the aggregate — only per-family competence. - GLiNER2 is competitive out of the box.
gliner2-largeposts 0.769 strict on CoNLL through an entirely different extraction API — worth having in any comparison.
None of these depend on the third decimal, which is exactly the point.
Takeaway
A zero-shot NER leaderboard is easy to produce and easy to get wrong. The three failure modes — incomparable aggregation, missing uncertainty, and protocol-blind absolute comparison — are what separate a number that informs a decision from a number that just looks authoritative. nerbench’s whole design is an attempt to be honest about all three: rank like-with-like, show the confidence interval, and never claim cross-protocol equivalence.
Code, configs, and the dashboard: github.com/yuriihavrylko/nerbench.