Benchmarking NER Inference Optimizations in Presidio: What Actually Made It Faster
ONNX Runtime, batch inference, and tokenizer-based chunking for Presidio's NER recognizers, benchmarked across five hardware platforms. The winning configuration flips with hardware class.
I’ve proposed three performance-oriented features for Presidio’s HuggingFaceNerRecognizer, currently open for review:
- ONNX Runtime backend (PR #2086) —
backend="ort"as an alternative to the default PyTorch pipeline - Batch inference (PR #2060) —
batch_analyze()with a configurableinference_batch_size - Tokenizer-based text chunking (PR #2041) —
TokenizerBasedTextChunkerpacks long documents into token-aligned windows instead of character-count guesses
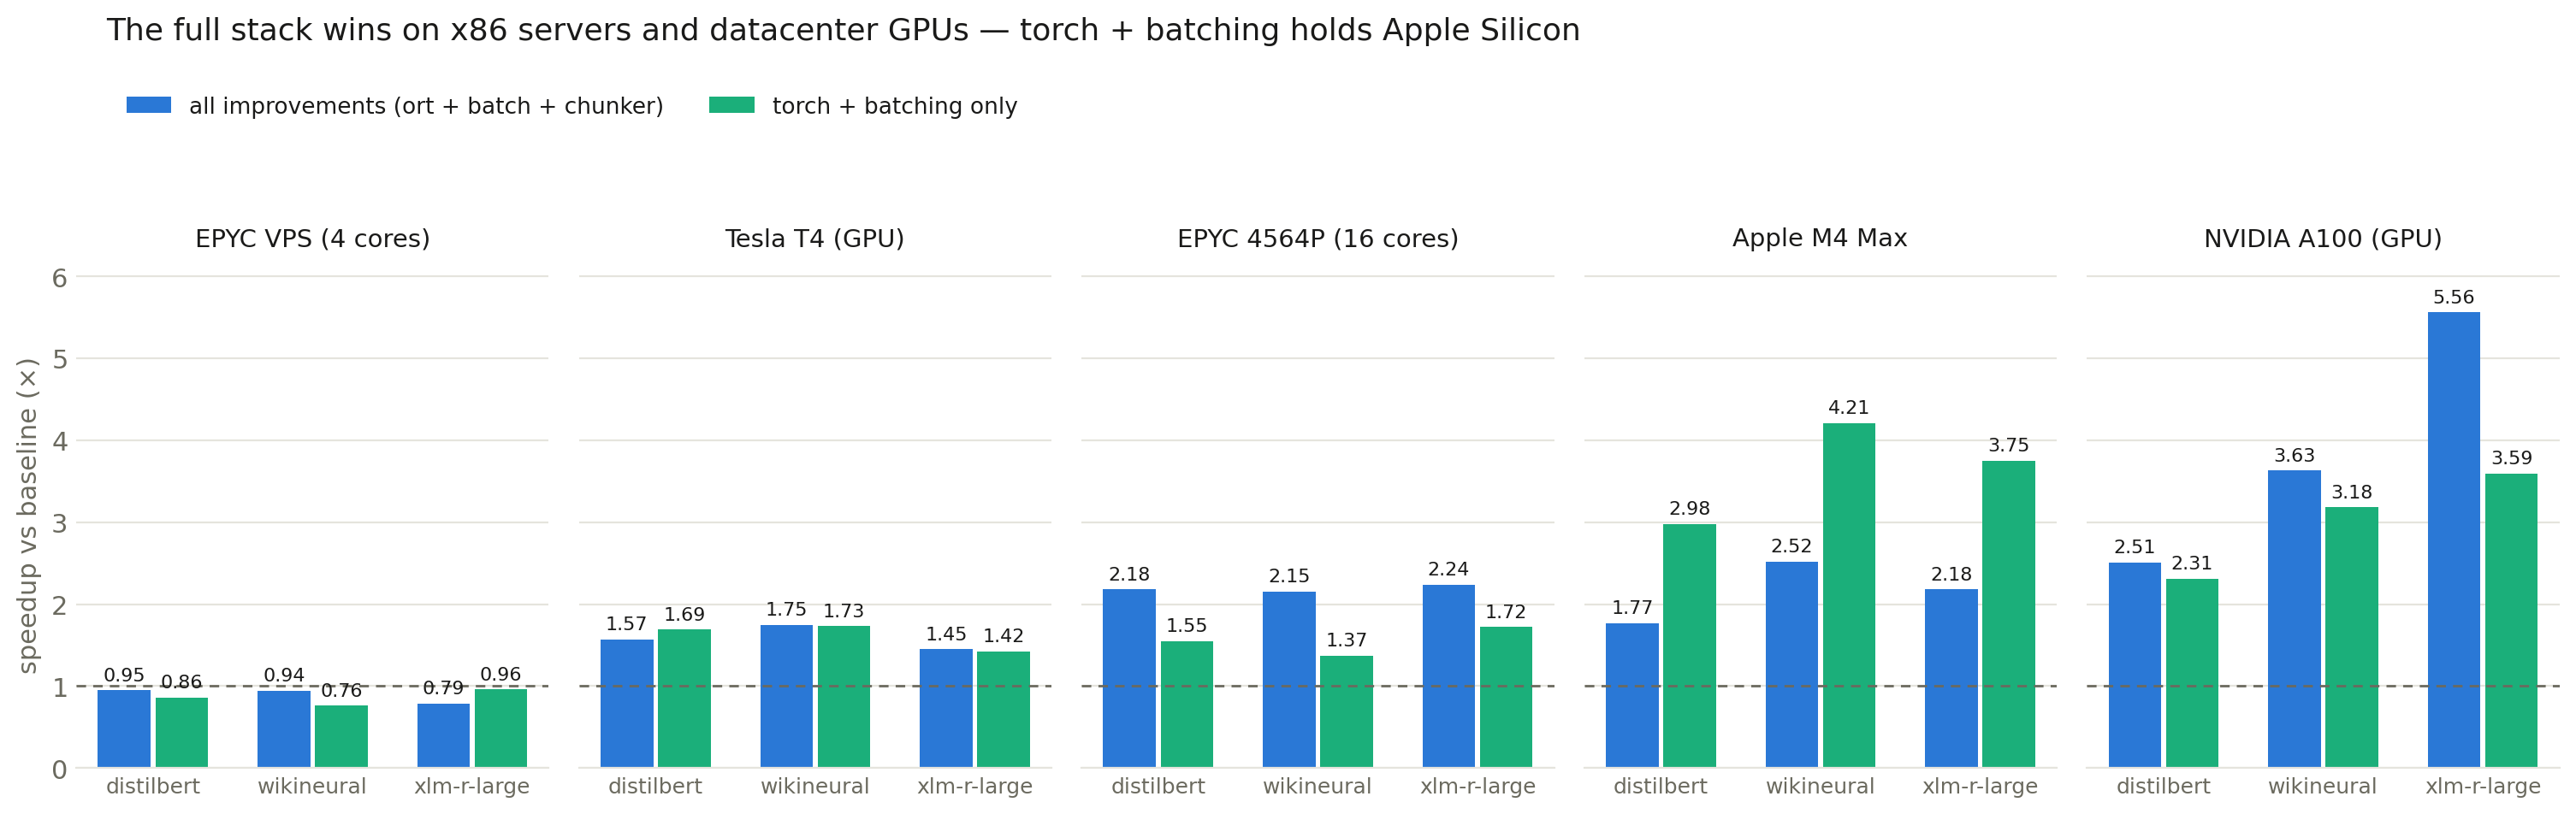
This post benchmarks them across three model sizes and five hardware platforms, on real data, measuring both throughput and latency. The headline result: which optimizations pay is decided by the hardware class. ONNX+batching wins on x86 servers and datacenter GPUs (up to 5.6x on an A100); plain PyTorch with batching wins on Apple Silicon; on small CPUs batching actively hurts and only ONNX-sequential helps. No single configuration is optimal everywhere — including the “turn everything on” one.
Everything here is reproducible with a single “Run all” in this Colab notebook.
Methodology
What’s measured. Two distinct quantities, because they have different winners:
- Throughput — total wall time to process 1000 texts, per configuration. This is the number that matters for bulk/offline PII scanning.
- Per-request latency — every sequential
analyze()call is timed individually, reported as p50/p95/p99 (from the final timed pass, so it costs no extra inference). For batch mode, the effective latency is one batch’s duration — every text in a batch completes when the whole batch does. Load time (construction + model load, including ONNX export where applicable) is recorded separately, since it’s the cold-start cost serverless deployments pay.
How it’s measured:
- Real data. N varied-length sentences (50–416 chars) from ai4privacy/pii-masking-200k, plus a 34.5K-char document (200 sentences concatenated) to exercise chunking. This matters more than anything else: benchmarking on one repeated hardcoded sentence makes the workload overhead-bound and padding-free, and overstates the gains by roughly 10x. Benchmark on data shaped like production traffic.
- Warm-up. Model download / ONNX export / load are excluded from throughput and latency timing; one full warm-up pass before measuring absorbs CUDA context init, cuDNN autotune, ONNX Runtime arena allocation, and tokenizer caches.
- Median of 3 timed passes, min/max reported. On dedicated hardware this gives sub-1% spreads.
- Entity counts checked on every measurement — a speedup that drops detections is a bug, not an optimization. Counts were deterministic across T4, Apple Silicon, and x86; the A100 showed a ±0.06% wobble across configs (floating-point nondeterminism at score-threshold boundaries).
- Baseline = the default configuration (torch backend, sequential
analyze(), character chunker). All three features are opt-in, so the default path is exactly what ran before they existed.
Runtime environment. Python 3.12, torch==2.10, transformers 4.x (pinned <5 — required by optimum-onnx), optimum + optimum-onnx, and onnxruntime for CPU / onnxruntime-gpu==1.20.1 for CUDA (the pin matters: newer wheels link against CUDA 13 while current Colab/torch stacks ship CUDA 12). The exact install sequence — including the ordering constraints around onnxruntime — is pinned in the notebook.
Models: dslim/distilbert-NER (66M), Babelscape/wikineural-multilingual-ner (278M), Davlan/xlm-roberta-large-ner-hrl (560M). “Combined” = ORT + batch=32 + tokenizer chunker. All FP32.
Results: three models, five platforms
NVIDIA A100 (Colab), 1000 texts:
| Model | Baseline | Combined | ort+batch alone | Combined speedup |
|---|---|---|---|---|
| distilbert-NER | 7.42s | 2.96s | 2.80s | 2.51x |
| wikineural | 11.66s | 3.21s | 2.98s | 3.63x |
| xlm-roberta-large | 18.42s | 3.31s | 3.18s | 5.56x |
Tesla T4 (Colab), 1000 texts:
| Model | Baseline | Combined | torch+batch alone | Combined speedup |
|---|---|---|---|---|
| distilbert-NER | 6.85s | 4.36s | 4.06s | 1.57x |
| wikineural | 11.49s | 6.55s | 6.64s | 1.75x |
| xlm-roberta-large | 21.32s | 14.70s | 15.04s | 1.45x |
Apple M4 Max (MacBook Pro), 1000 texts:
| Model | Baseline | Combined | torch+batch alone | Batching speedup |
|---|---|---|---|---|
| distilbert-NER | 12.78s | 7.21s | 4.29s | 2.98x |
| wikineural | 33.46s | 13.28s | 7.95s | 4.21x |
| xlm-roberta-large | 83.00s | 38.01s | 22.14s | 3.75x |
AMD EPYC 4564P (RunPod, 16 dedicated cores), 1000 texts:
| Model | Baseline | Combined | ort+batch alone | torch+batch | Combined speedup |
|---|---|---|---|---|---|
| distilbert-NER | 11.95s | 5.47s | 5.39s | 7.70s | 2.18x |
| wikineural | 21.47s | 9.98s | 9.71s | 15.71s | 2.15x |
| xlm-roberta-large | 71.20s | 31.78s | 31.00s | 41.36s | 2.24x |
EPYC VPS (4 cores), 1000 texts:
| Model | Baseline | Combined | ort sequential | torch+batch | Combined speedup |
|---|---|---|---|---|---|
| distilbert-NER | 28.55s | 30.09s | 20.13s | 33.30s | 0.95x |
| wikineural | 55.75s | 59.56s | 40.09s | 73.29s | 0.94x |
| xlm-roberta-large | 185.42s | 235.01s | 151.70s | 192.87s | 0.79x |
The tables split into three regimes. On x86 servers and the A100, the winner is ONNX+batching (the full stack minus the chunker), and on the A100 its lead grows with model size. On Apple Silicon (and, within noise, the T4), plain torch+batching is fastest. On the 4-core box, every batched config loses to the baseline’s own sequential loop — the only thing that helps there is switching the backend, and the full stack is 21% slower than doing nothing for the large model:
Finding 1: batching’s value is a function of idle parallel capacity
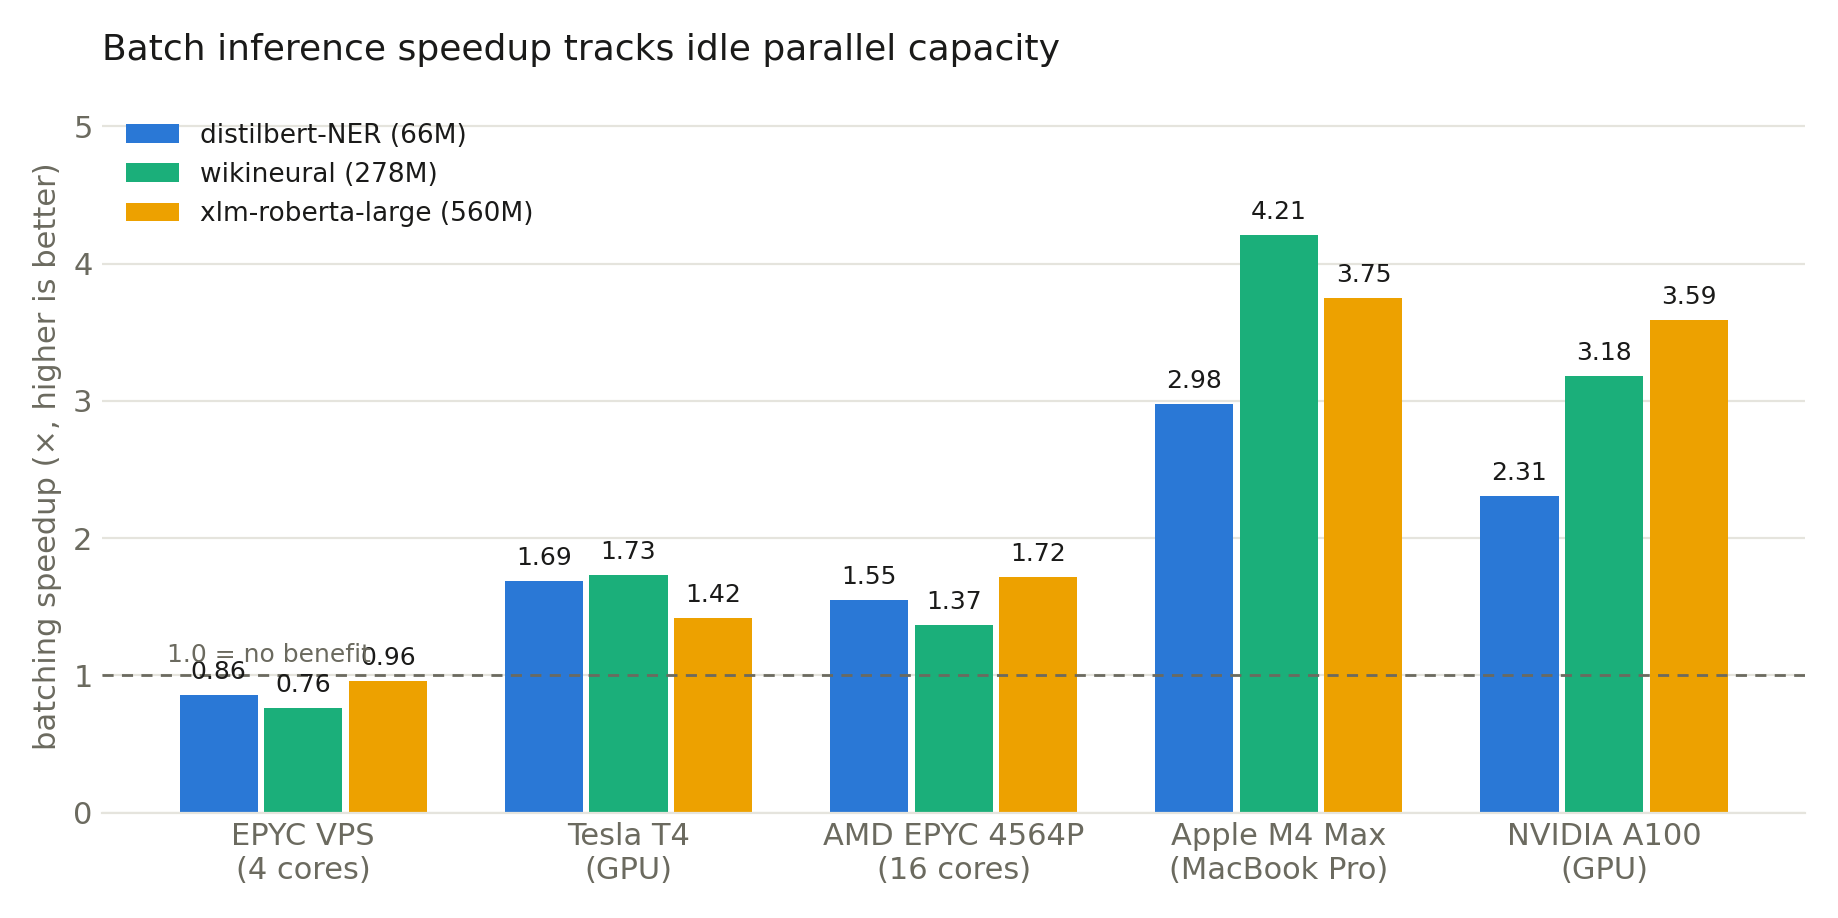
Batching wins by filling otherwise-idle execution capacity, and the measured speedups line up with how much idle capacity each platform has:
4-core EPYC: 0.76–0.96x (a loss) → 16-core EPYC / Tesla T4: 1.4–1.7x → NVIDIA A100: 2.3–3.6x on torch (and more with ORT — Finding 2) → Apple M4 Max: 3.0–4.2x
A small CPU has no idle capacity — one text already saturates it, and batching only adds padding waste, hence the clean 0.76–0.96x loss on the dedicated 4-core slice. The M4 Max shows the largest CPU gains for a structural reason: at batch=1, big-model CPU inference is memory-bandwidth-bound (the entire weight matrix streams through per text — 2.2GB for xlm-roberta-large); batching reuses each weight fetch 32 times, and PyTorch reaches Apple’s AMX matrix units via the Accelerate framework, which ONNX Runtime’s NEON kernels never touch. The same mechanism explains why larger models gain more from batching on M-series (3.8–4.2x vs distilbert’s 3.0x) while the gain shrinks with size on the T4, where a bigger model already keeps the GPU busy at batch=1.
One implementation detail worth knowing: batched chunks are length-sorted internally before hitting the pipeline. Batched pipelines pad every sequence to the longest in its batch, and with real mixed-length text in arrival order, 51% of batch tokens are padding. Sorting similar lengths together cuts that substantially — worth up to ~23% on compute-bound configurations.
Finding 2: where ONNX Runtime pays
Sequential, ORT is genuinely good everywhere: ~1.4–1.9x on x86 versus torch sequential, ~1.8–2.9x on the M4 Max. If your service handles one request at a time, use it.
Its batched path is platform-dependent:
- ORT+batching wins on x86 servers and datacenter GPUs. Big hardware stays dispatch-bound at batch=32, and dispatch overhead is precisely what ORT’s fused graph eliminates — fusion compounds with batching. On the A100 it delivers 2.1–3.4x over ORT-sequential and beats torch+batch by up to 1.61x (3.18s vs 5.13s for xlm-roberta-large); on the 16-core EPYC it beats torch+batch by 1.33–1.62x.
- torch+batching wins on Apple Silicon — torch reaches the AMX matrix units via Accelerate; ORT’s ARM kernels can’t, so ORT’s batched path is a loss there.
- On the T4 the two are a tie — the modest GPU is compute-saturated by big models at batch=32, so backend choice is irrelevant. T4 and A100 sit in different regimes on the same capacity curve; GPU results don’t generalize across GPU classes.
- On small CPUs (≤4 cores), don’t batch at all — every batched config lost to sequential; ORT-sequential is the only optimization that helps (1.2–1.4x).
One reliability caveat: ORT’s batched CPU performance is environment-sensitive in a way torch’s isn’t — two sessions on identical 16-core EPYC hardware measured it flat (1.0x) and strongly positive (1.2–1.5x), most plausibly due to pod or onnxruntime build differences. Verify it in your own environment before depending on it.
Quantization is the remaining untested lever: pre-quantized INT8 models change the math itself. On Apple Silicon (no VNNI instructions) INT8 was worth only ~1.15x with a ~3% detection loss. On AVX512-VNNI hardware the published gains are 2–4x.
Finding 3: tokenizer chunking helps long documents — and entity counts are model-specific
On the 34.5K-char document, token-aligned chunking (200-token windows) cut the chunk count from 169 to 55 and saved 1.2–1.3x; using the model’s full 512-token window cut it to 21 chunks and saved 1.5–2.1x. On short texts that never chunk, the tokenizer chunker is a small net cost — it tokenizes every text just to decide “no chunking needed.”
The accuracy footnote is important. Changing chunk size changed detection counts in a model-specific direction, reproduced identically across all platforms: distilbert lost ~30% of detections at full-window chunks (long-input degradation), wikineural found more (it benefits from added context), and xlm-roberta didn’t care. If you touch chunking, validate recall for your model — there is no universal rule.
Finding 4: GLiNER plays by its own per-platform rules
Presidio’s GLiNERRecognizer (zero-shot PII detection) supports batching and custom chunking too, plus its own native ONNX path (load_onnx_model=True — a different mechanism from the HF recognizer’s optimum backend). Measured on four platforms, in time per text:
| Platform | torch seq | torch+batch | ONNX seq | ONNX+batch | Best config |
|---|---|---|---|---|---|
| NVIDIA A100 (500 texts) | 30.4ms | 2.9ms | 12.7ms | 1.6ms | ONNX + batch |
| Apple M4 Max (100 texts) | 87.0ms | 28.6ms | 17.9ms | 28.9ms | ONNX sequential |
| EPYC 16 cores (100 texts) | 61.0ms | 29.2ms | 704.3ms | 443.1ms | torch + batch |
| EPYC 4 cores (100 texts) | 178.3ms | 136.9ms | 1160.0ms | 554.7ms | torch + batch |
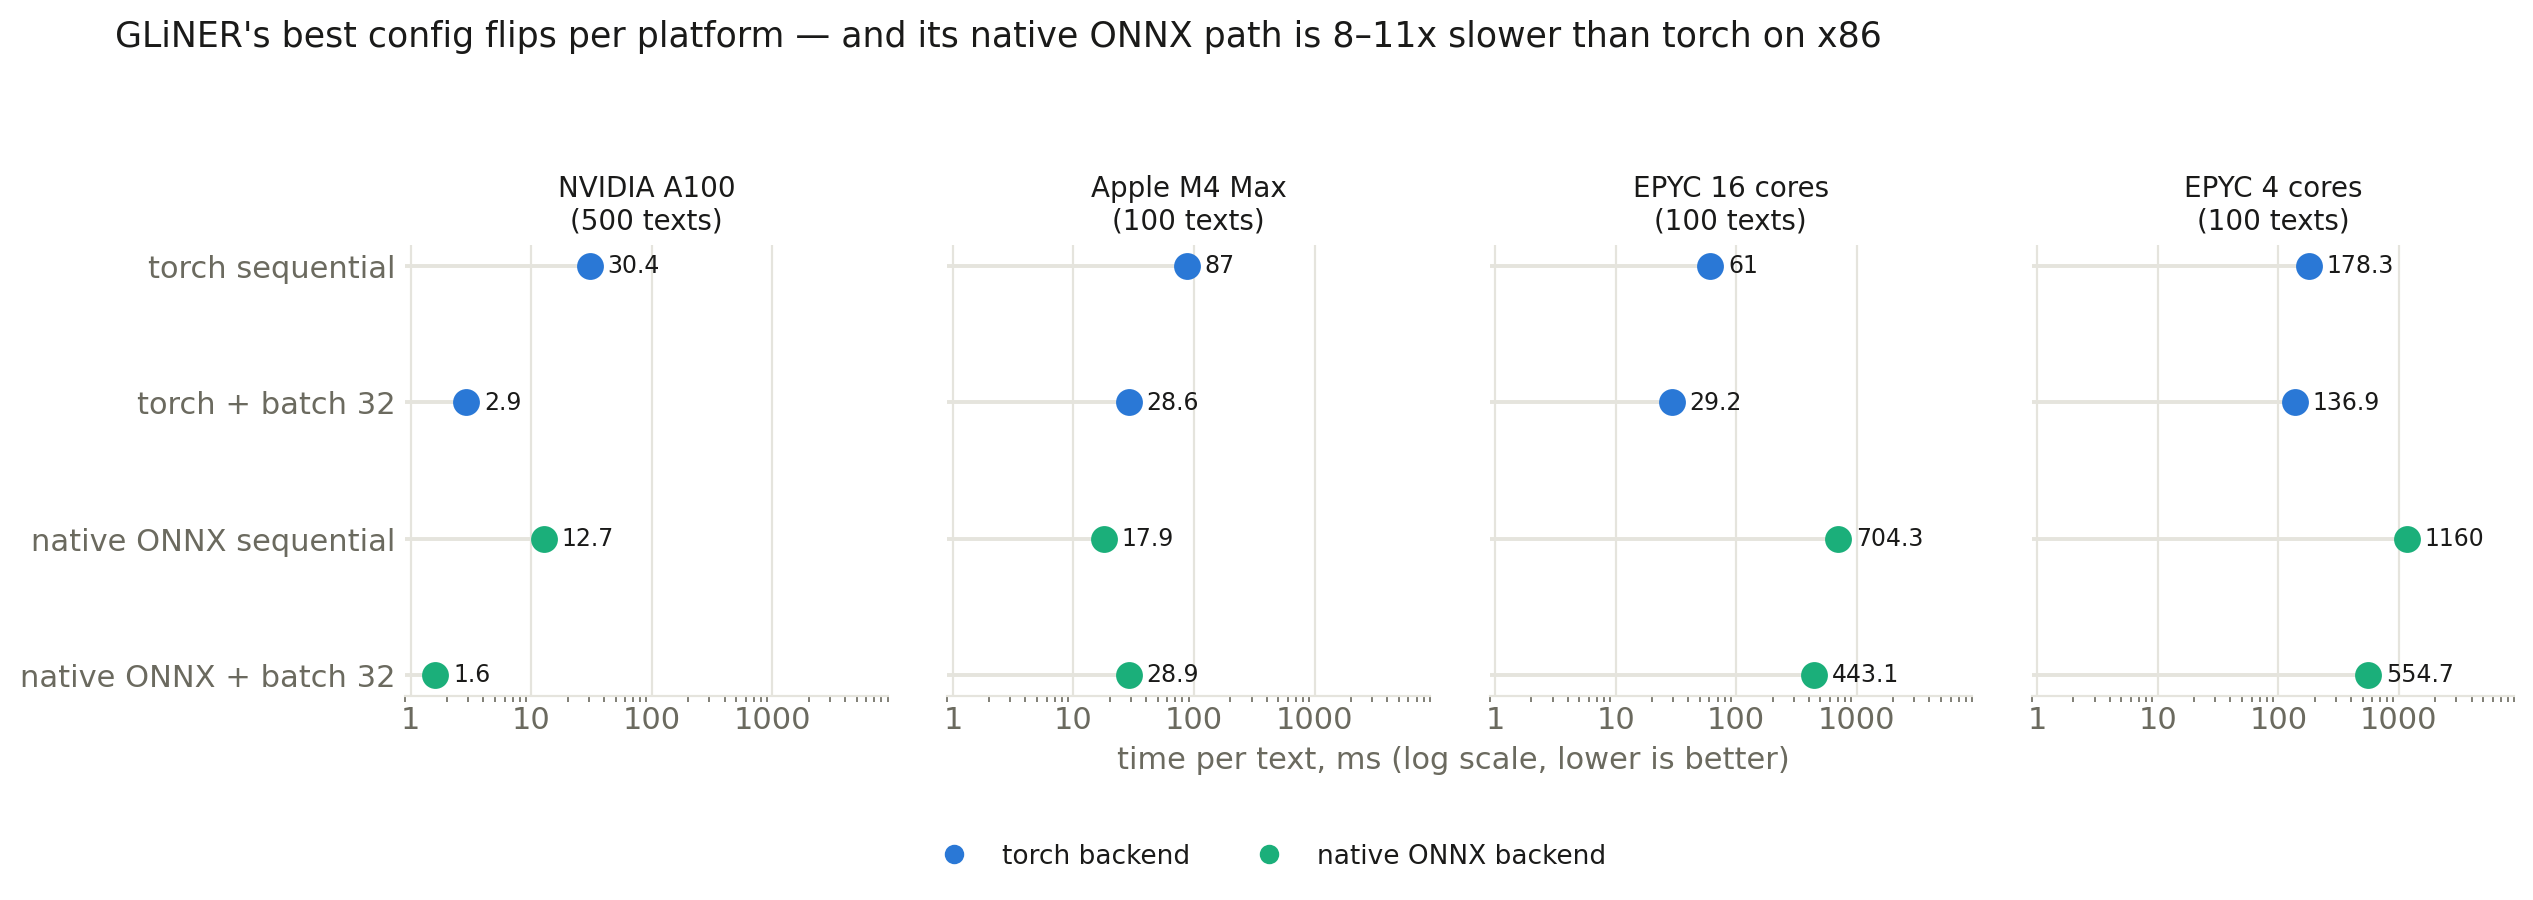
Three platform-specific behaviors:
- On the A100, ONNX+batching wins — consistent with the HF datacenter-GPU result, but amplified: batching is worth 10.7x on torch and 7.9x on ONNX, the largest batching gains measured anywhere in this benchmark. GLiNER’s per-text sequential cost is high (30ms even on an A100), which leaves that much more idle GPU for batching to fill.
- On Apple Silicon, ONNX sequential wins (4.9x over torch sequential). GLiNER’s bi-encoder span logic runs in eager PyTorch with far more fusion headroom than a plain HF pipeline, so ONNX conversion pays off big; both batched paths converge to ~29ms/text regardless of backend (fixed per-batch overhead in GLiNER’s DataLoader path).
- On x86 CPUs, GLiNER’s native ONNX path is pathological: 8–11x slower than torch sequential (704ms vs 61ms per text on 16 cores), with high run-to-run variance and ~3.4x the load time — from the same model file that performs well on ARM and CUDA. The cause wasn’t isolated; treat it as a second instance of ONNX Runtime’s CPU behavior being environment-sensitive, and never enable
load_onnx_modelon x86 without measuring first. torch (plus batching from ~8 cores up) is the only sensible x86 config.
Latency follows the same split: on the A100 and M4 Max, ONNX sequential has the best p50 (12.1ms and 17.9ms); on x86, torch sequential wins by 8x+ (57ms vs 477ms p50 on 16 cores). For scale against the HF models: even GLiNER’s best config per platform runs ~1.5–10x the per-text cost of distilbert’s — the price of zero-shot flexibility.
Finding 5: throughput and latency disagree — measure both
Everything above is throughput. Per-request latency is a different quantity with a different winner (see Methodology) — and the pattern is the same on every platform:
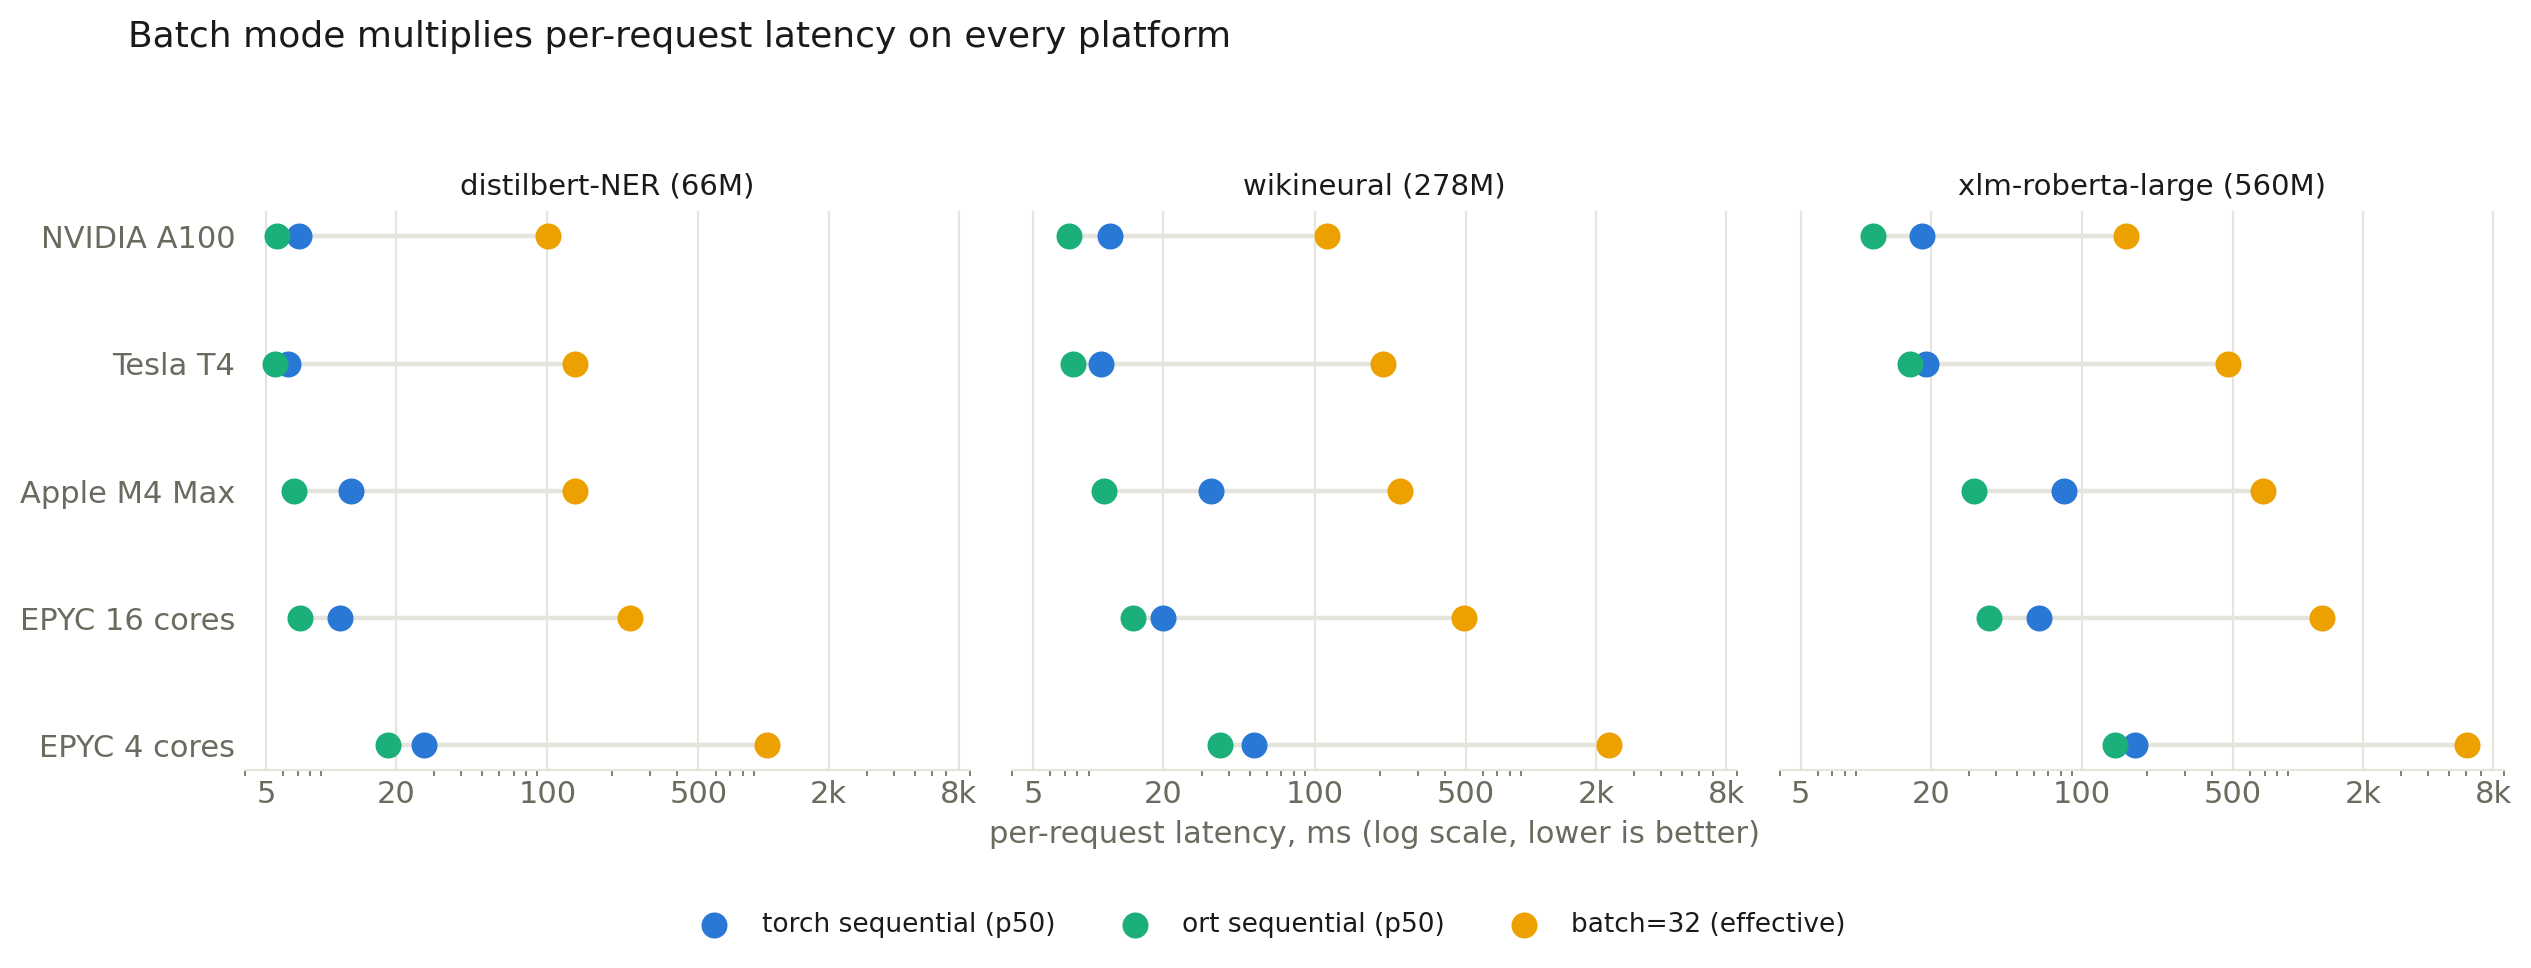
Per-request latency on the T4 (ms; sequential = p50/p95/p99):
| Model | torch sequential | ort sequential | batch=32 effective | load: torch / ort |
|---|---|---|---|---|
| distilbert-NER | 6.3 / 9.7 / 12.6 | 5.5 / 8.8 / 11.6 | 134.8 | 8.0s / 19.5s |
| wikineural | 10.3 / 16.7 / 20.2 | 7.6 / 11.5 / 13.7 | 206.9 | 46.3s / 31.2s |
| xlm-roberta-large | 19.1 / 29.4 / 32.9 | 16.0 / 26.1 / 28.3 | 473.0 | 21.6s / 73.6s |
On the M4 Max CPU the same pattern holds, only stronger: ORT sequential p50 beats torch by 1.8–3.1x (wikineural: 10.6ms vs 33.1ms), and batch mode’s effective latency runs 134–692ms. On the A100, ORT sequential leads as well (10.8ms vs 18.3ms p50 for xlm-roberta-large) with the tightest tails of any platform (p99 ≈ 1.15x p50), and batch effective latency is 100–160ms. x86 agrees: ORT sequential wins p50 on both the 16-core EPYC (7.2ms vs 11.0ms for distilbert) and the 4-core VPS (18.4ms vs 26.9ms) — making it the p50 winner on every platform measured.
Three things the throughput tables hide:
- Batching multiplies per-request latency by roughly batch size ÷ throughput gain. On the T4 that’s 32/1.5 ≈ 21x — a 6ms request becomes a 135ms one; on the 4-core box, effective latency reaches 6 seconds. For bulk offline scanning that’s irrelevant; for an interactive API it’s disqualifying —
inference_batch_sizeis a latency/throughput dial, not a free win. - ORT sequential is the latency winner on both GPU and CPU — lower p50 everywhere, and on the T4 also tighter tails than torch (wikineural p99: 13.7ms vs 20.2ms). One platform nuance: on the M4 Max the tail picture flips — torch’s p99/p50 is a tight ~1.35x while ort’s spreads to 1.8–2.4x, so ort has the better median there but torch is more predictable. Tail behavior is backend-and-platform-specific; measure yours.
- ONNX export is a cold-start cost: ort load took 2–3x torch’s (73.6s for xlm-roberta-large on the T4) — the export runs at load time. For serverless/autoscaling, use a pre-converted ONNX repo instead of
export=True.
Size your SLAs on the tail, not the median — p99 ran 1.3–2.4x p50 depending on model, backend, and platform.
The deployment cheat sheet
| Scenario | Best config |
|---|---|
| HF model, batch/offline throughput on datacenter GPU or x86 server (≥8 cores) | backend="ort" + batch_analyze — up to 5.6x vs baseline on an A100, ~2.2x on a 16-core EPYC |
| HF model, batch/offline throughput on Apple Silicon (or a T4) | torch + batch_analyze — Accelerate/AMX keeps torch ahead there |
| HF model, latency-sensitive serving (any hardware) | backend="ort", sequential — best p50 on every platform measured |
| HF model on small CPUs (≤4 cores) | backend="ort", sequential — don’t batch; every batched config lost to sequential |
| GLiNER on datacenter GPU | load_onnx_model=True + batch_analyze — 19x over torch sequential on an A100 |
| GLiNER on Apple Silicon | load_onnx_model=True, sequential |
| GLiNER on x86 CPU | torch (+ batch_analyze from ~8 cores) — its native ONNX is 8–11x slower there |
| Long documents (either recognizer) | add TokenizerBasedTextChunker; validate entity counts for your model |
| Serverless / frequent cold starts | avoid export=True; load a pre-converted ONNX repo |
The takeaway: hardware class picks the configuration, and no single setup is optimal everywhere — not even “turn everything on,” which ranges from best-config-minus-~5% (A100) to 21% slower than doing nothing (large model on a 4-core box). Results measured on one hardware class do not transfer to another: backend choice is irrelevant on a T4 but decisive on an A100; ORT batching is a loss on Apple Silicon but the winner on x86 servers; batching itself flips from a loss on 4 cores to a 4x win on an M4 Max. Benchmark on the hardware you’ll deploy on — the notebook below makes that a single “Run all.”
Reproduce it
The whole benchmark is one self-contained notebook — it clones the branch, installs pinned dependencies (including the onnxruntime-gpu==1.20.1 pin needed on CUDA-12 Colab), pulls the dataset, runs all three models plus the optional GLiNER section, and prints consolidated throughput, latency, and load-time tables:
Run it on your own hardware — as the five platform tables above show, the right answer genuinely depends on where you deploy.